install.packages('ggplot2')
library(ggplot2)
data(ChickWeight)
data(mtcars)
data(economics)
X-Y graph
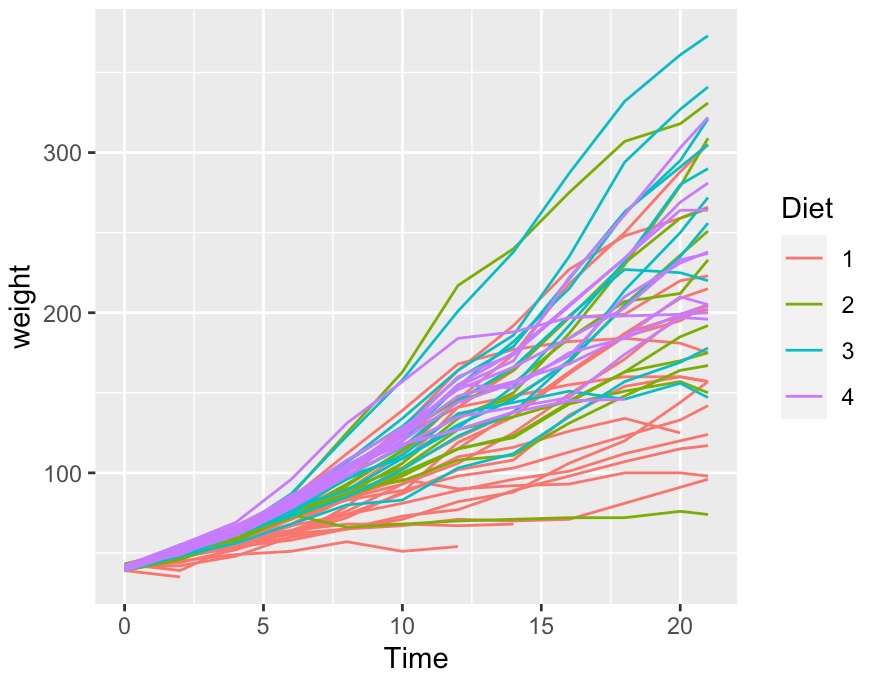
ggplot(ChickWeight, aes(x=Time, y=weight, colour=Diet, group=Chick))+geom_line()
aes()
Construct aesthetic mappings
x
y
col, color, colour, fg
group
fill
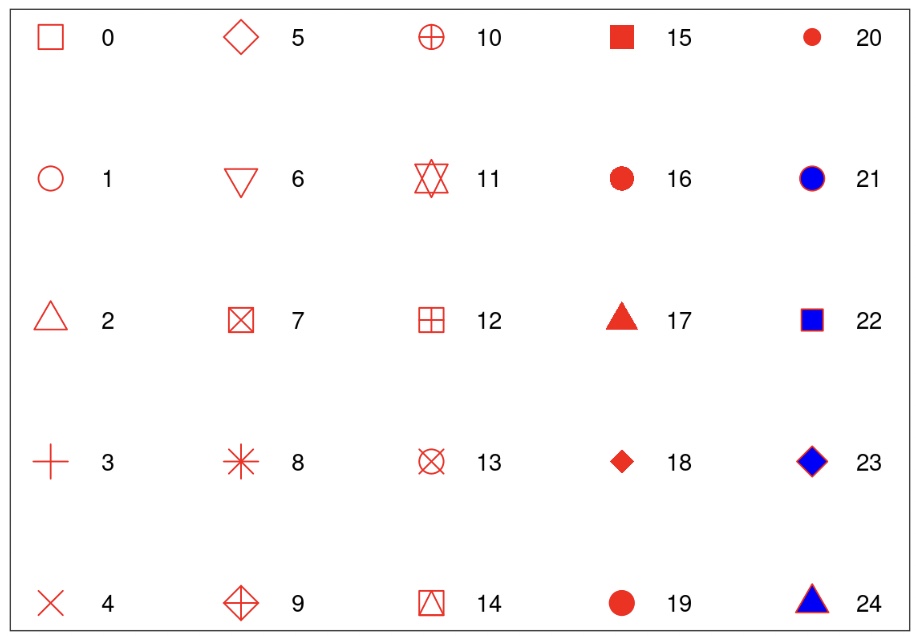
shape
alpha
geom_line() // 선을 연결(col에 따라)
geom_point() // scatter plot의 투명도와 사이즈 지정
mapping
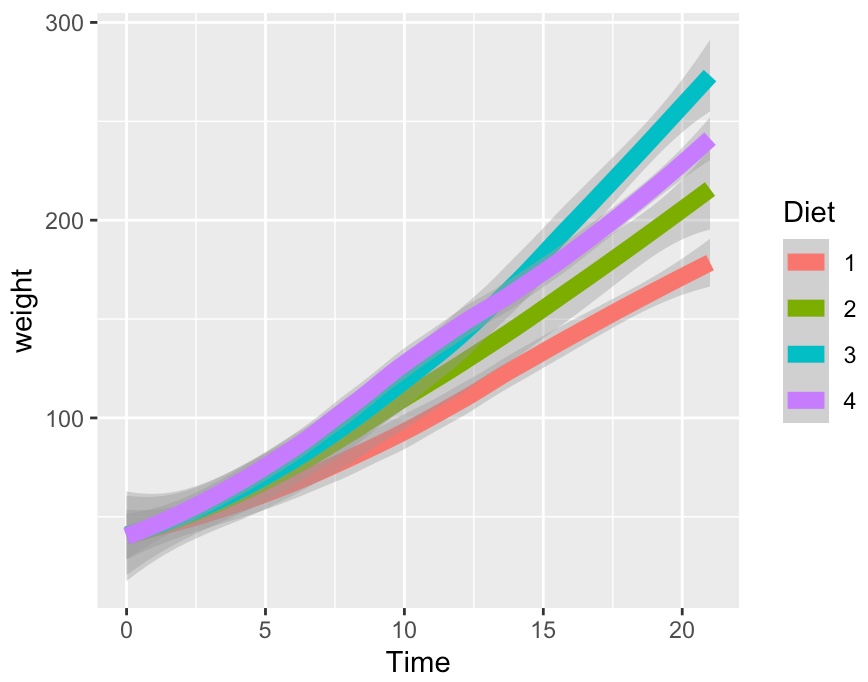
geom_smooth() // 배경 색상의 투명도와 평균값 선의 굵기를 조정
shape
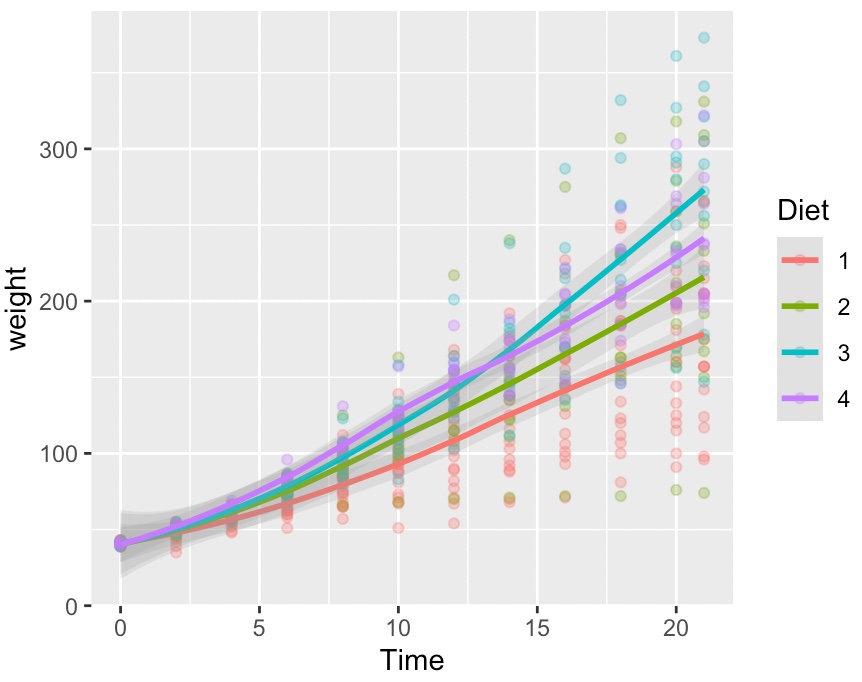
ggplot(ChickWeight, aes(x=Time, y=weight, col=Diet))+geom_point(alpha=.3)+geom_smooth(alpha=.2, size=1)
h<-ggplot(ChickWeight, aes(x=Time, y=weight, col=Diet))
h+geom_point(alpha=.3)

ggplot(ChickWeight, aes(x=Time, y=weight, col=Diet))+geom_smooth(alpha=.4, size=3)
Histogram
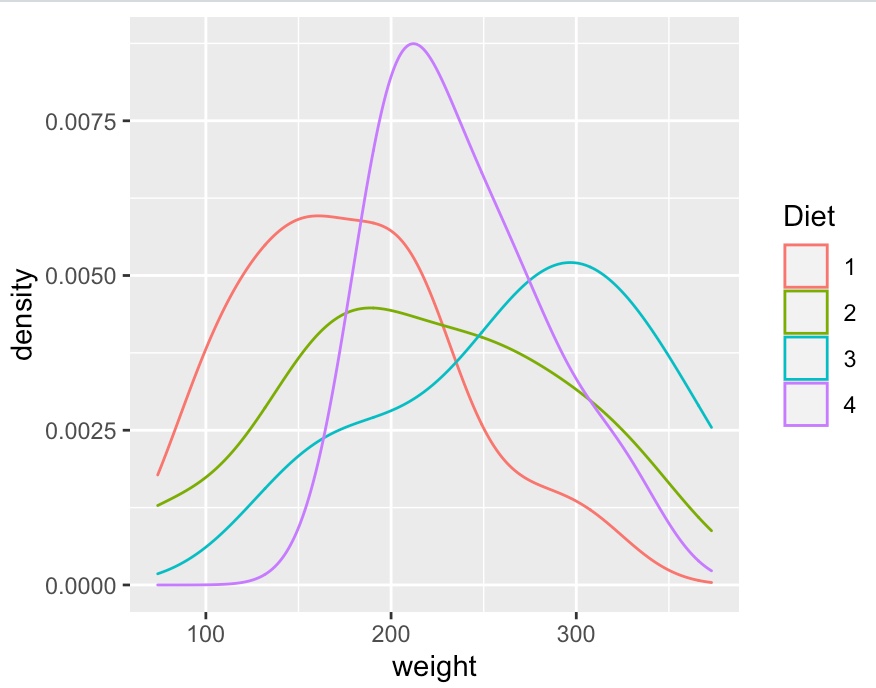
geom_density() // 밀도를 추가
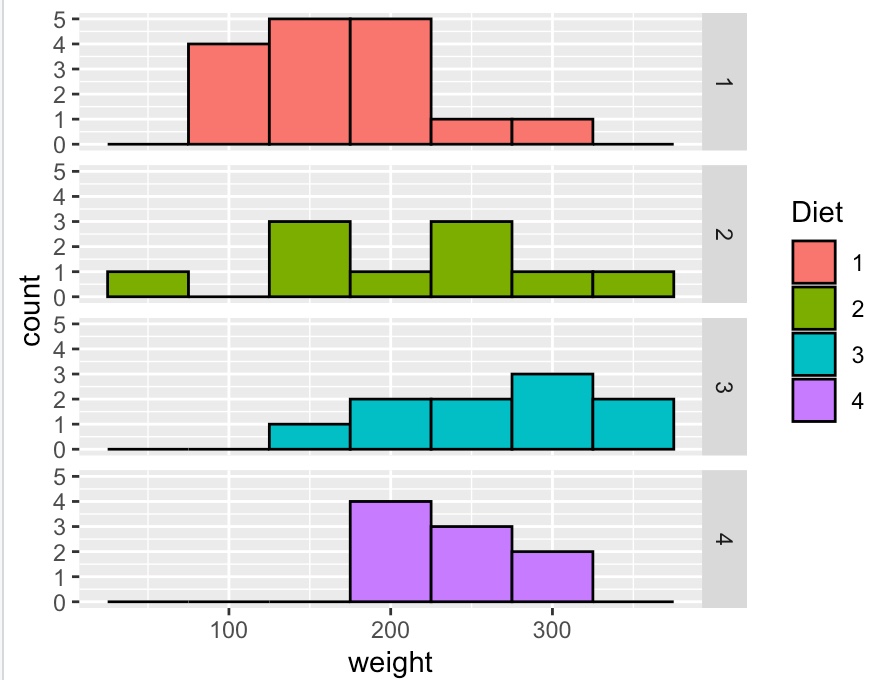
geom_histogram()
facet_grid() // 그래프의 가로, 세로 방향 지정
ggplot(subset(ChickWeight, Time==21), aes(x=weight, col=Diet))+geom_density()
ggplot(subset(ChickWeight, Time==21), aes(x=weight, fill=Diet))+geom_histogram(col="black", binwidth=50)+facet_grid(Diet~.)
ggplot(subset(ChickWeight, Time==21), aes(x=weight, fill=Diet))+geom_histogram(col="black", binwidth=50)+facet_grid(.~Diet)

Point Graph
qplot() // quick plot base::plot과 사용법이 유사(qplot은 df로 data 전달 가능)
coord_cartesian( xlim, ylim )
scale_colour_continuous( breaks )
guides(colour=“colourbar”) // colorbar에 눈금 추가
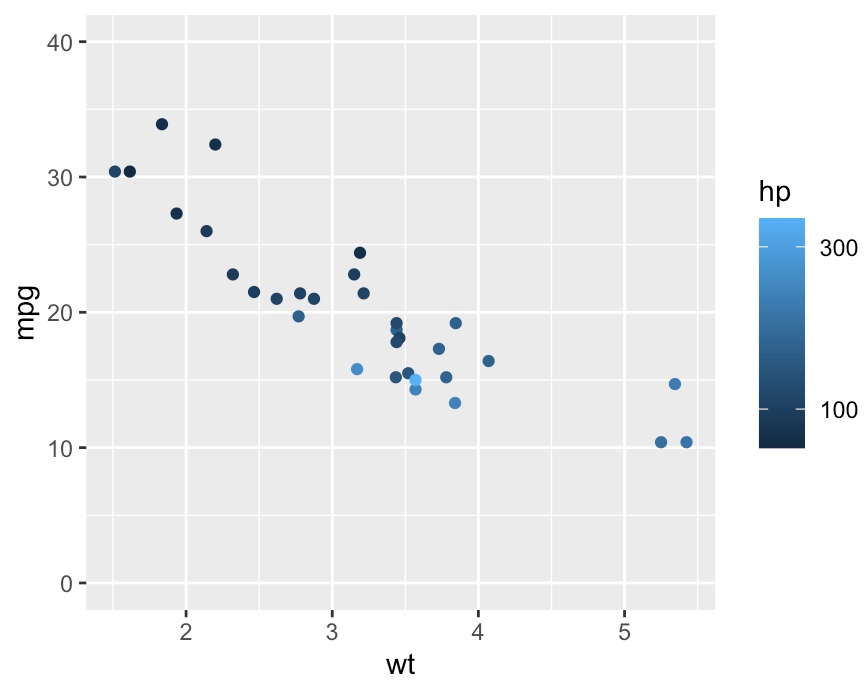
p<-qplot(wt, mpg, colour=hp, data=mtcars)
# similar with p<-plot(mtcars$wt, mtcars$mpg, col=mtcars$hp)
p<-p+coord_cartesian(ylim=c(0, 40)) # ylim 지정
p<-p+scale_colour_continuous(breaks=c(100, 300)) # col의 hp 범위 지정
p<-p+guides(colour="colourbar")
p
m<-mtcars[1:10, ]
p%+%m
ggplot에서 %+% 연산자는 data override 하는데 사용된다.

Bar Graph
geom_bar()
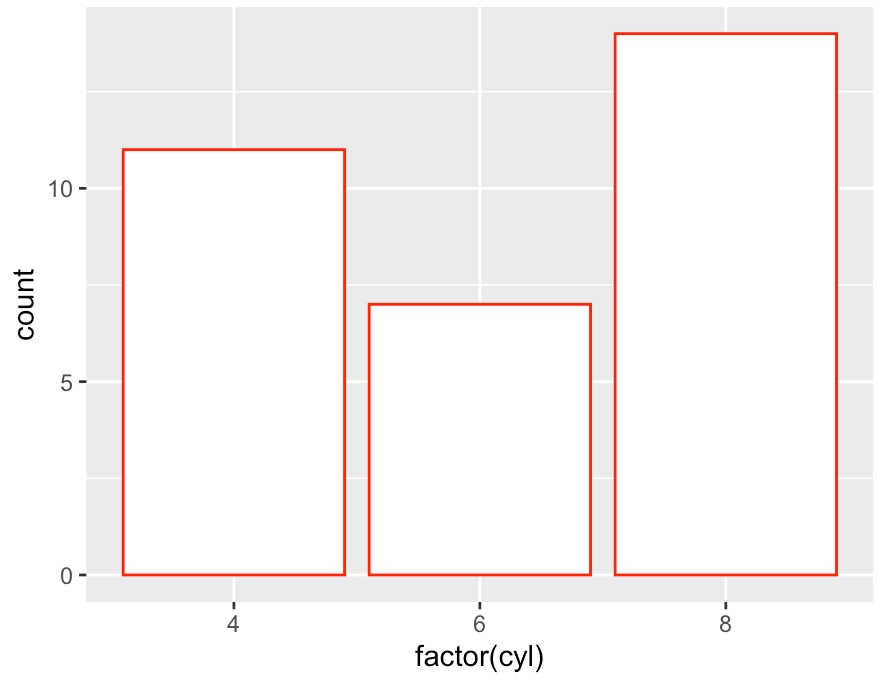
fill // 막대그래프 색상
colour // 테두리 색상
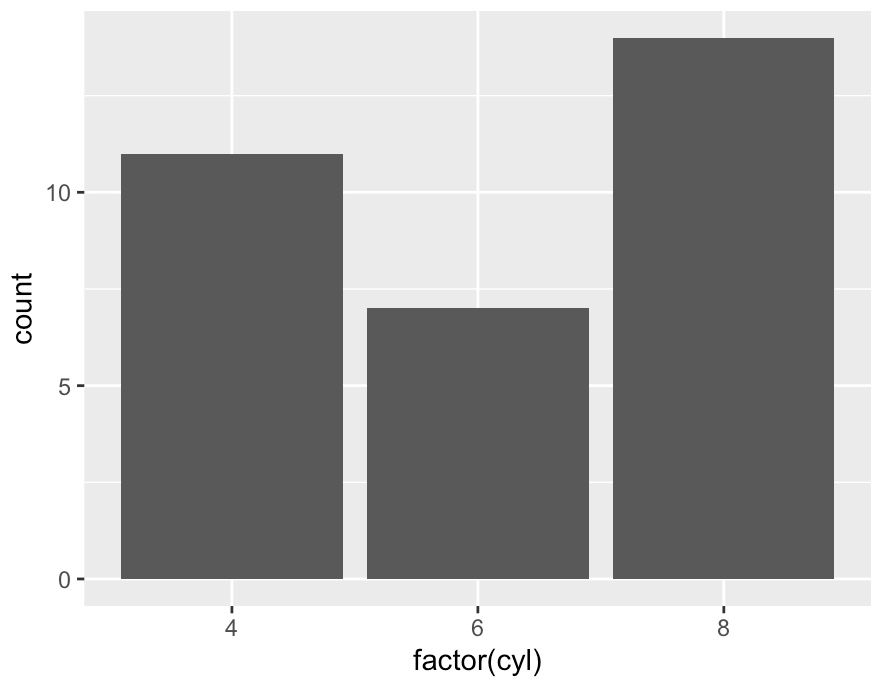
c<-ggplot(mtcars, aes(factor(cyl)))
c+geom_bar()
c+geom_bar(fill="white", col="red")
ggplot 함수에서 채움 색을 변수로 지정할 수 있다.
k<-ggplot(mtcars, aes(factor(cyl), fill=factor(vs)))
k+geom_bar()

히스토그램(geom_histogram)에서 연속형 count를 색상으로 표
시
m<-ggplot(movies, aes(x=rating))
m+geom_histogram()
m+geom_histogram(aes(fill=..count..))
ggplot에서 ..count.. , ..density.. 등은 special variables로 사용된다.
Line Graph
geom_line()
colour
size
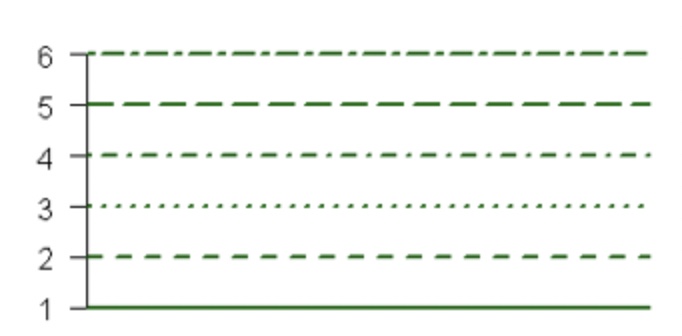
linetype
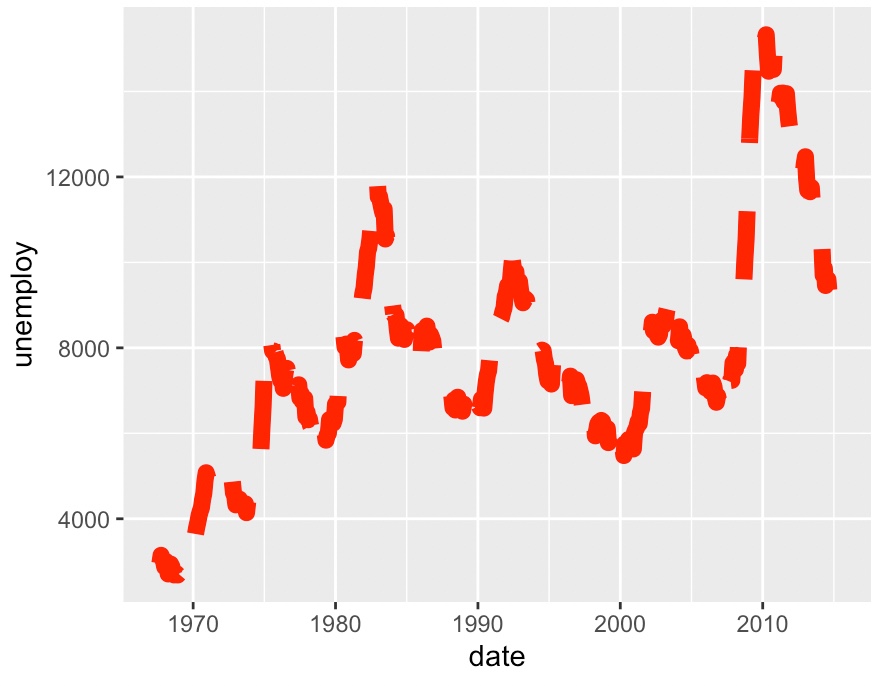
b<-ggplot(economics, aes(x=date, y=unemploy))
b+geom_line()

b+geom_line(colour="red", size=3, linetype=2)
linetype
